top of page

Projects


Industry-Level Forecasting and Volatility Analysis
Developed an industry-level forecasting framework to help retailers plan under uncertainty.
The analysis measures volatility, forecast reliability, and the impact of supply and demand shocks.


Income-Adjusted Customer Spending Analysis
Explores how customer spending intensity changes when adjusted for local income levels. Identifies overspending and behavioral outliers across income brackets using SQL and Tableau. Reveals which customer segments drive disproportionate or unstable spending patterns.


Home Services Performance Dashboards
Models a real home services company through two interactive dashboards, revealing high-margin services, seasonal demand shifts, and efficiency opportunities that inform pricing, marketing, and operational decisions.


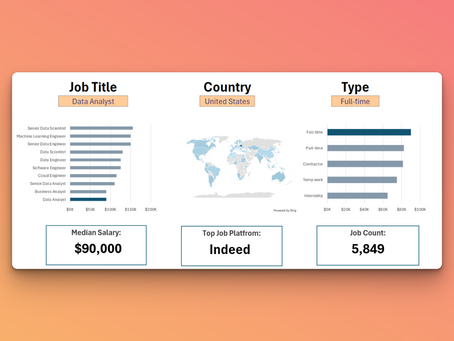
Exploring Salary Trends by Role and Work Type in Excel (Part 1)
Built an interactive Excel dashboard using 32,000+ job listings to explore salary patterns by role, location, and schedule type. Designed clean, user-friendly visuals that make job market insights easy to understand and compare.


Analyzing How Skills Impact Salary Using Excel (Part 2)
This Excel analysis uses Power Query, DAX, and PivotTables to reveal how key skills like Python, SQL, and AWS influence pay in data roles. The dashboard highlights top-paying skills, regional salary gaps, and how specialization shapes earning potential.
bottom of page