top of page

Projects


Financial Performance Dashboard
This dashboard explores how a synthetic multi-division business behaves across revenue, margins, forecasting, cash flow, and expenses. Even with simplified data, the patterns reveal stable operations, predictable cost structure, and where process discipline breaks down.


Reducing Customer Churn for Veridian Networks
A Power BI case study exploring customer churn at Veridian Networks, a fictional telecom provider. Uncovers key drivers of retention, revenue loss, and actionable strategies to reduce churn.


Industry-Level Forecasting and Volatility Analysis
Developed an industry-level forecasting framework to help retailers plan under uncertainty.
The analysis measures volatility, forecast reliability, and the impact of supply and demand shocks.


Income-Adjusted Customer Spending Analysis
Explores how customer spending intensity changes when adjusted for local income levels. Identifies overspending and behavioral outliers across income brackets using SQL and Tableau. Reveals which customer segments drive disproportionate or unstable spending patterns.


Home Services Performance Dashboards
Models a real home services company through two interactive dashboards, revealing high-margin services, seasonal demand shifts, and efficiency opportunities that inform pricing, marketing, and operational decisions.


Regional E-Commerce Performance & Delivery Trends in Brazil
Analyzed over 100,000 Olist marketplace orders to reveal regional sales trends, delivery performance gaps, and freight inefficiencies across Brazil, using SQL and Tableau.


Airline Customer Satisfaction Dashboard (Tableau Visualization Project)
Explored global airline review data to identify patterns in customer satisfaction across time, regions, and aircraft types. Designed a Tableau dashboard that transforms raw feedback into actionable insights.


Fitbit Data Insights for Bellabeat
Analyzed Fitbit user behavior over 30 days to uncover trends in sleep and activity, helping Bellabeat tailor product features and boost user engagement.


Mapping the Data Analyst Job Market with SQL
Analyzed real data analyst job postings to reveal where high demand meets high pay. This project highlights which skills drive the strongest career opportunities and helps professionals prioritize learning paths that maximize long-term value.


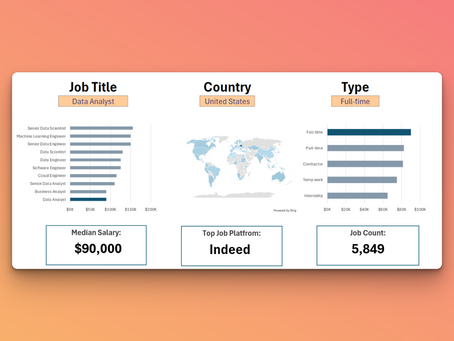
Exploring Salary Trends by Role and Work Type in Excel (Part 1)
Built an interactive Excel dashboard using 32,000+ job listings to explore salary patterns by role, location, and schedule type. Designed clean, user-friendly visuals that make job market insights easy to understand and compare.


Analyzing How Skills Impact Salary Using Excel (Part 2)
This Excel analysis uses Power Query, DAX, and PivotTables to reveal how key skills like Python, SQL, and AWS influence pay in data roles. The dashboard highlights top-paying skills, regional salary gaps, and how specialization shapes earning potential.
bottom of page