Fitbit Data Insights for Bellabeat
- James Gifford
- Jun 25
- 4 min read

Updated: Oct 10
Insights to guide Bellabeat’s product positioning and marketing strategy
📌 Project Objective
Bellabeat aims to better understand how smart device users track their activity and sleep in order to strengthen its wellness product strategy.
This analysis uses anonymized Fitbit data as a market proxy to uncover behavioral patterns and identify opportunities for Bellabeat’s Leaf wellness tracker.
The goal is to translate user behavior insights into actionable ideas for product development, feature design, and marketing positioning.

Bellabeat’s Leaf wellness tracker - the product this analysis aims to inform
❓ Guiding Questions
How do users engage with their smart devices daily?
What patterns exist in physical activity and sleep behavior?
How can Bellabeat use these insights to encourage healthier habits?
🧠 Executive Summary
This project analyzes one month of Fitbit usage data to reveal how users balance movement and rest.
It identifies trends in daily activity, sleep patterns, and engagement rhythms that Bellabeat can leverage to promote healthier, more consistent habits.
Findings suggest that weekday structure, light activity dominance, and sleep timing are the biggest behavioral factors shaping engagement potential for wellness apps.
🖥 Slide Deck Presentation
View the full slide-based version of this analysis: 🔗 Open Slide Deck
📈 Key Activity & Sleep Metrics
These summary stats reflect Fitbit user behavior over one month.
Metric | Average Value |
|---|---|
Avg Total Steps | 7,638 |
Avg Very Active Minutes | 21 min |
Avg Fairly Active Minutes | 14 min |
Avg Lightly Active Minutes | 3 hr 13 min |
Avg Sleep Efficiency | 92% |
Avg Time Asleep | 6 hr 59 min |
Avg Time in Bed | 7 hr 39 min |
🛠 SQL Queries
PostgreSQL was used to calculate the KPIs displayed above. While these calculations could have been done in Tableau, SQL was used here to practice querying and ensure reproducibility.
🧹 Data Cleaning Overview
For full details on how the raw Fitbit datasets were prepared and transformed in Excel Power Query:
📊 Data Visualizations & Insights
1. Minutes Asleep by Weekday

Insights:
Users sleep the most on Wednesday, with strong midweek averages overall.
Monday and Friday show the shortest sleep durations, while Sunday has moderate to high totals.
This pattern may reflect disruptions at the start and end of the workweek.
Recommendations:
Bellabeat could offer sleep reminders or wind-down prompts on Sunday and Thursday nights to encourage better sleep before the workweek starts or ends.
2. Daily Step Distribution

Insights:
Most user-days average between 3k–12k steps, with a steep drop-off beyond 15k.
This suggests moderate activity levels are common, while high-activity days are rare.
Recommendations:
Bellabeat could promote increased movement through progress-based goals or streak incentives.
3. Calories vs. Active Minutes

Insights:
More active minutes per day generally lead to higher calorie burn, but the relationship is only moderately correlated. Individual variation likely plays a role.
Recommendations:
Bellabeat can improve calorie tracking by personalizing estimates using user profiles and historical data.
4. Steps by Weekday

Insights:
Users average the most steps on Tuesdays and Wednesdays.
Weekend step counts drop, likely due to fewer routine-based activities (like commuting or gym sessions).
Recommendations:
Bellabeat can nudge weekend movement using features like:
Weekend step goals
Social activity prompts
Mini fitness challenges
5. Sleep Efficiency vs. Active Minutes
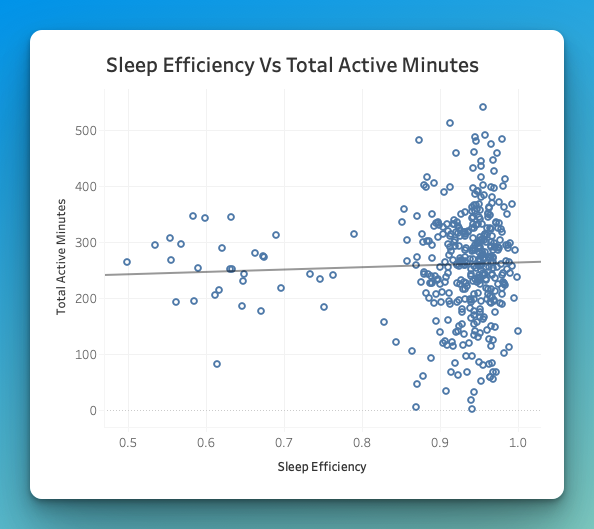
Insights:
There’s no meaningful relationship between daily active minutes and sleep efficiency in this dataset.
Recommendations:
No action needed related to sleep efficiency. Bellabeat may focus efforts on sleep duration instead.
6. Steps vs. Minutes Asleep

Insights:
There’s no strong correlation between total steps and minutes asleep.
Some users who sleep more are less active, while others maintain moderate steps and sleep - suggesting sleep and activity are independent for most users.
Recommendations:
Avoid linking sleep and activity in feedback or goals.
Provide separate, personalized targets for rest and movement to support overall balance.
7. Steps vs. Calories Burned

Insights:
Positive relationship: more daily steps generally lead to more calories burned.
Most users fall between 3k-12k steps and 1,800-2,800 calories.
Recommendations:
Encourage step-based calorie burn goals or badges to drive motivation and reinforce the activity-calorie link in Leaf marketing.
🔍 Key Insights & Recommendations
Insight | Recommendation |
Users average about 7 hours of sleep, with shorter durations on Mondays and Fridays. | Introduce early-week sleep nudges or Sunday wind-down prompts. |
Most movement is light activity (~3 hrs/day), with limited high-intensity activity. | Use goal streaks and progressive step challenges to boost movement intensity. |
Peak steps occur midweek; weekend activity drops noticeably. | Add weekend challenges or social activity prompts to sustain momentum. |
Strong link between steps and calories burned. | Reinforce “steps = burn” messaging to highlight visible progress. |
Sleep efficiency is high, but duration is limited. | Position Bellabeat as a “sleep optimizer,” helping users sustain high-quality rest. |
Most users cluster between 3K–10K steps daily. | Design app goals and achievement tiers around realistic activity ranges. |
📈 Business Impact
This market analysis highlights where user habits create opportunity for engagement in Bellabeat’s product ecosystem.
By aligning features with natural routines and realistic targets, Bellabeat can increase daily app interaction, improve retention, and position its Leaf product as both a motivator and wellness companion.


Comments